

")


I estimated three models, 2021-2025M08, resulting in adjusted R2 of between 0.54 (based on ADP data) to 0.71 (based on ADP data). Here’s what I got for forecasts of September and October private NFP as reported by BLS:
For the ARIMA(1,1,1) in the preliminary benchmark BLS series.
 in BLS Private NFP vs. ADP Based ECM")

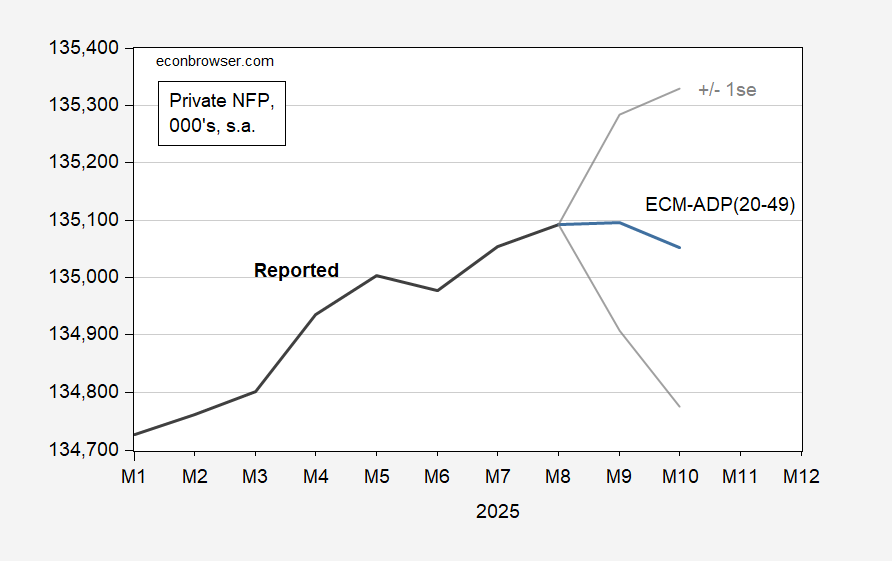
For an ECM in the ADP ratio of total private NFP to employment in firms 20-49:
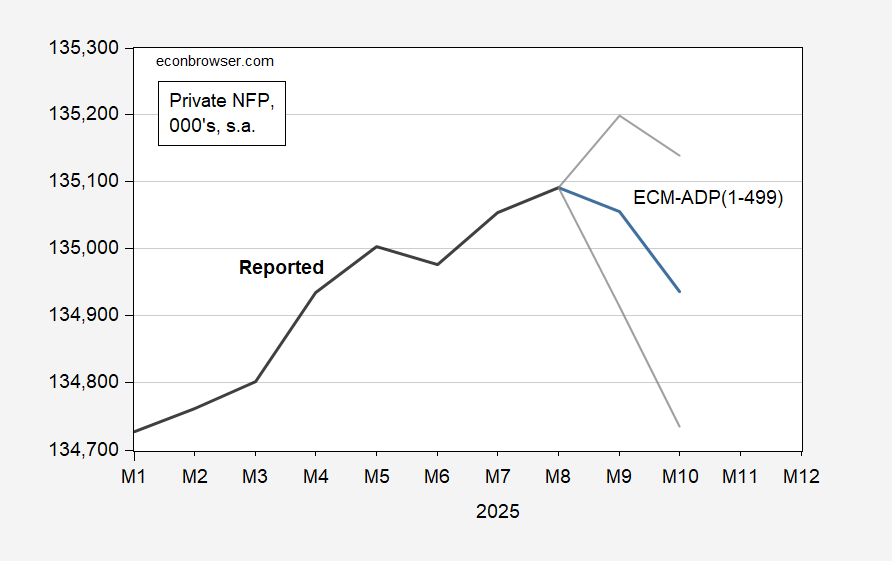
For an ECM of private NFP to firms 1-499:
A comparison:
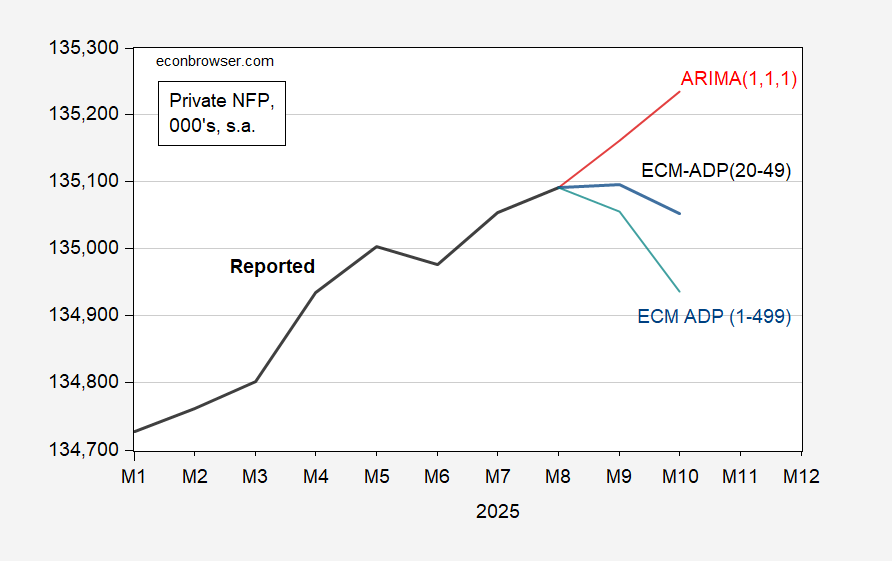
Obviously, without much difference between adjusted R2‘s, there’s not a lot of basis to choose one over the other, although the adjusted R2 for an ECT involving employment in firms 1-499 employees vs. total private has the highest (at 0.71). Using the highest R2 specification, change in employment is -36K and -199K in September and October (although increases are entirely possible given the large prediction intervals).
One interesting point is that I can reject the null hypothesis that the ratio of firm employment 1-499 to total private Granger causes the log difference in BLS private NFP (at 10% msl), but not the reverse.


