

")


by Calculated Risk on 6/23/2025 08:11:00 AM
Altos reports that active single-family inventory was up 0.4% week-over-week.
Inventory is now up 32.7% from the seasonal bottom in January and is increasing.
Usually, inventory is up about 18% to 19% from the seasonal low by this week in the year. So, 2025 is seeing a larger than normal pickup in inventory.
The first graph shows the seasonal pattern for active single-family inventory since 2015.
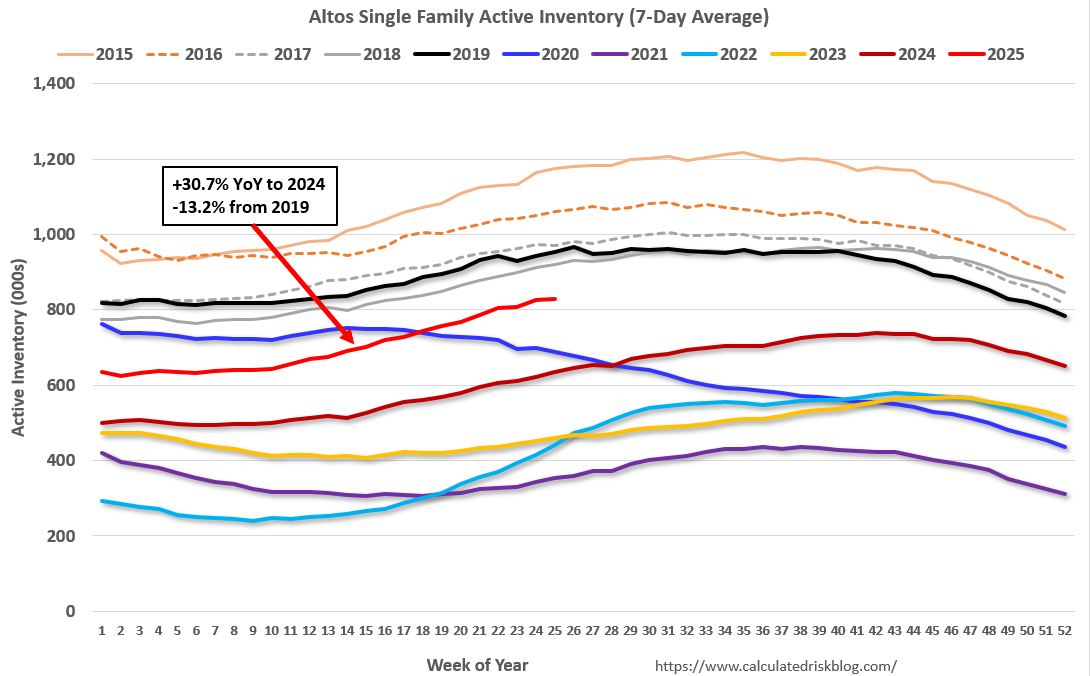
The red line is for 2025. The black line is for 2019.
Inventory was up 30.7% compared to the same week in 2024 (last week it was up 33.1%), and down 13.2% compared to the same week in 2019 (last week it was down 12.4%).
This is the highest level since 2019.
It now appears inventory will be close to 2019 levels towards the end of 2025.

As of June 20th, inventory was at 829 thousand (7-day average), compared to 826 thousand the prior week.


