


Beware the aggregates. The slowdown is showing up in smaller firms first, according to BLS Business Employment Dynamics data.


Figure 1: Cumulative employment gain for firms with employees 1-999 (blue), for firms with more than 1000 employees (tan), both from 2024Q1, in 000’s s.a. Source: Business Employment Dynamics from BLS.
Employment in large firms grew over 2024, while those for smaller firms sagged before rising back up to Q1 levels. Frustratingly, BED data only extends through Q4, while Q1 numbers will only become available at end-October (assuming no delays due to the government shutdown).
ADP has a breakdown between 1-499 and greater than 500 employees, that extends to end of Q3. These series exhibit a similar pattern.
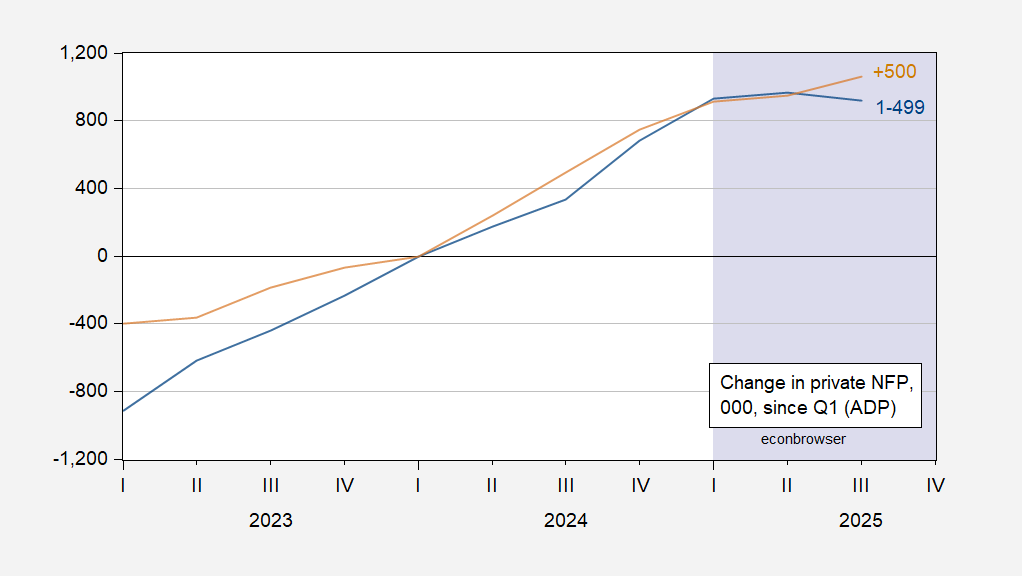
Figure 2: Change in employment in firms with employment between 1-499 (blue), and firms with employment 500 and greater (tan), both from 2024Q1, 000’s, s.a. Source: ADP via FRED and author’s calculations.
As noted previously, a slowdown is often presaged by differential behavior of small vs. large firms attributable to the financial accelerator (Bernanke, Gertler and Gilchrist, REStat, 1996).
Finally a, speculative graph. In the absence of the BLS employment release, we have guesses of employment levels.
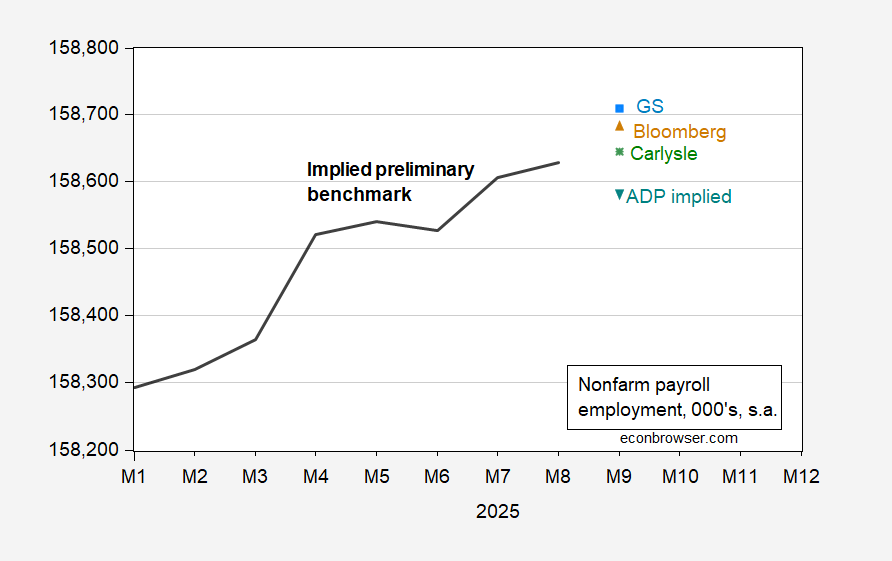

Figure 3: Nonfarm payroll employment implied from preliminary benchmark (bold black), Goldman Sachs (light blue square), Bloomberg consensus (tan triangle), Carlysle (green *), and ADP implied private NFP plus August government employment (inverted teal triangle), all in 000’s, s.a. ADP implied private NFP estimated using regression, described here, plus government employment levels for August. Source: BLS via FRED, BLS, Goldman Sachs, Bloomberg, WSJauthor’s calculations.


