


Jim will have examination of the GDP numbers tomorrow, but here is the picture as of today, in the wake of the international trade figures, industrial production, housing starts, yesterday and today.


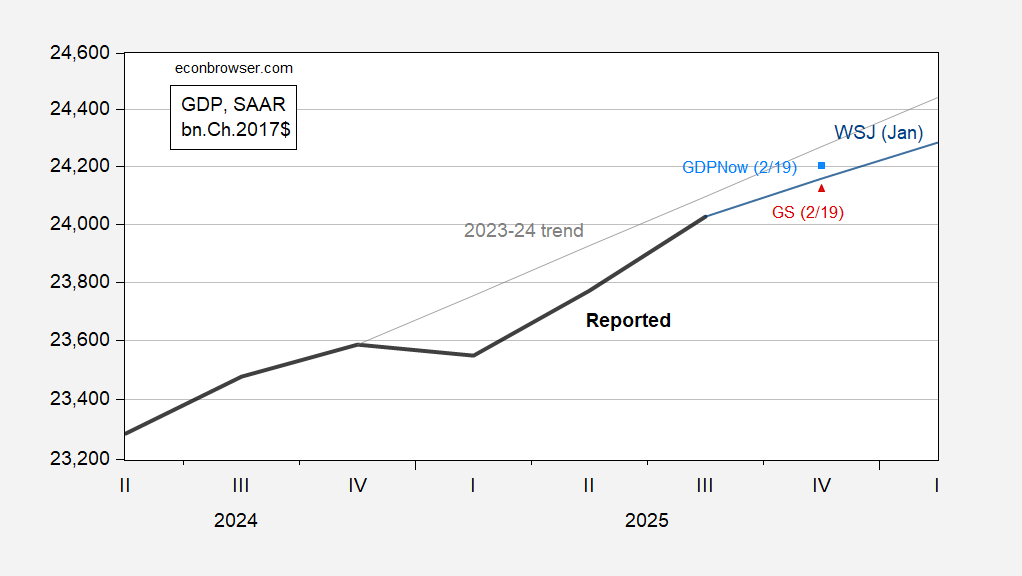
Figure 1: GDP as reported (bold black), GDPNow (sky blue square), Goldman Sachs tracking (red triangle), January WSJ survey mean (blue), and 2023-24 stochastic trend (gray), all in bn.Ch.2017$ SAAR, on log scale. Source: BEA, Atlanta Fed, Goldman Sachs, WSJ January Survey of Economists, and author’s calculations.
Note that there’s a wide divergence in q/q AR growth rates nowcasted: GDPNow is at 3%, while GS is at 1.6%. Even with rapid growth like 3%, we have not re-attained the 2023-24 trend.
Once one strips out volatile foreign elements (exports, imports) and inventories, one gets more of a consensus. Here’s a plot of “Core GDP”, which is final sales ex-imports, imports and government spending.
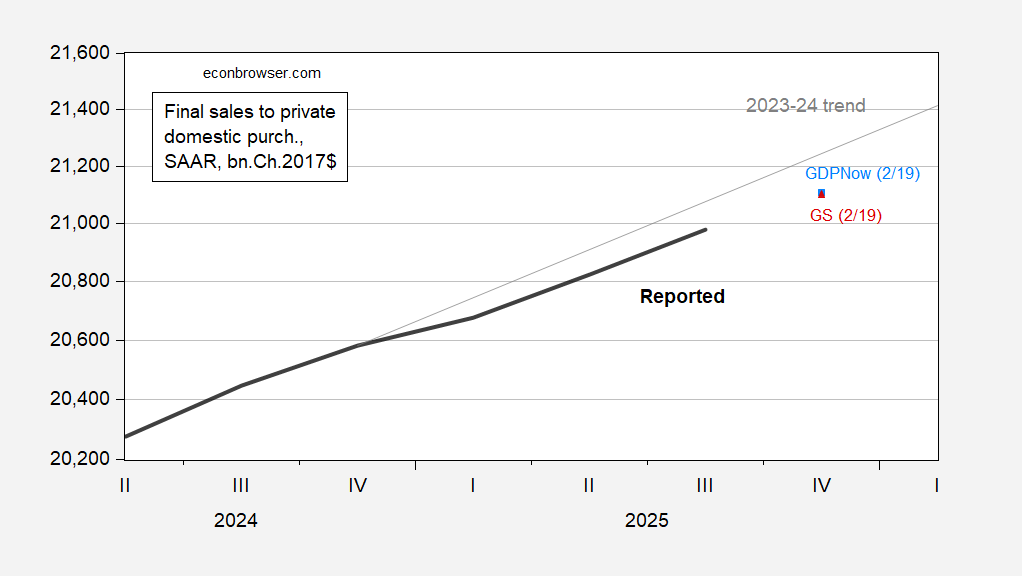
Figure 2: Final sales to private domestic purchasers as reported (bold black), GDPNow (sky blue square), Goldman Sachs tracking (red triangle), and 2023-24 stochastic trend (gray), all in bn.Ch.2017$ SAAR, on log scale. Source: BEA, Atlanta Fed, Goldman Sachs, and author’s calculations.
From Figure 2, it’s clear that as currently estimated we are not closing in on the 2023-24 trend. To the extent that “Core GDP” proxies for trend aggregate demand, then the economy appears to be on a track that is falling further and further below the 2023-24 trend. That being said, CBO estimates 0.9 percentage point of GDP fiscal stimulus emanating from provisions of the BBB in 2026, so this year might look different.


