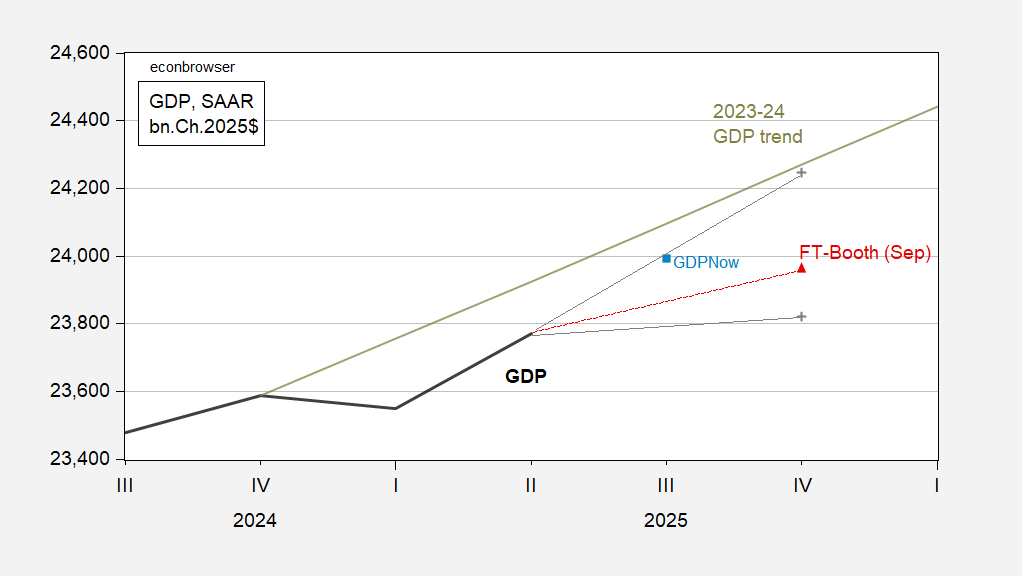
That’s q4/q4, as noted in the survey results for September.

FIgure 1: GDP (bold black), FT-Booth September survey median (red triangle), 10/90 percentile interval (gray +), GDPNow of 9/1 (light blue square), and 2023-24 trend (chartreuse), all in bn.Ch.2017$ SAAR. Source: BEA 2025q2 3rd release/annual benchmark revision, FT-Booth Seeptember surveyAtlanta Fed, and author’s calculations.
The median survey response of 1.6% is just below my estimate of 1.7%. While the current GDPNow nowcast is at the upper end of the 10/90 percentile interval, the St. Louis Fed’s at essentially zero growth (not shown) is below the 10th percentile (see this post).

