
Fed Chair Powell has suggested that the BLS birth-death model is overstating per month job creation by 60K since April. If so, nonfarm payroll employment is trending down.

Figure 1: Official nonfarm payroll employment (blue), implied preliminary benchmark revision (bold black), ADP implied (tan), implied preliminary benchmark revision plus Powell conjecture (light blue), CPS employment series adjusted to NFP concept, experimental series with smoothed population controls (red), change since January 2025.
While official nonfarm payroll employment has grown a healthy 600K from January to September, the implied benchmark revision has only grown 400K over the corresponding period. Putting together the implied benchmark revision with the Powell conjecture, the NFP has only risen 61K since January.
In this context, the household survey employment series adjusted to the NFP concept is not too far off from this 61K level, at +200K in August. More interestingly, the adjusted household series peaked in March, the conjectured series in April.
Could we be in a recession? With many indicators still into positive range, it’s important to recall employment is one of the two key indicators followed by the NBER’s BCDC.
Is there any other coincident indicator to examine? In the past, I’ve used y/y growth in heavy truck sales.
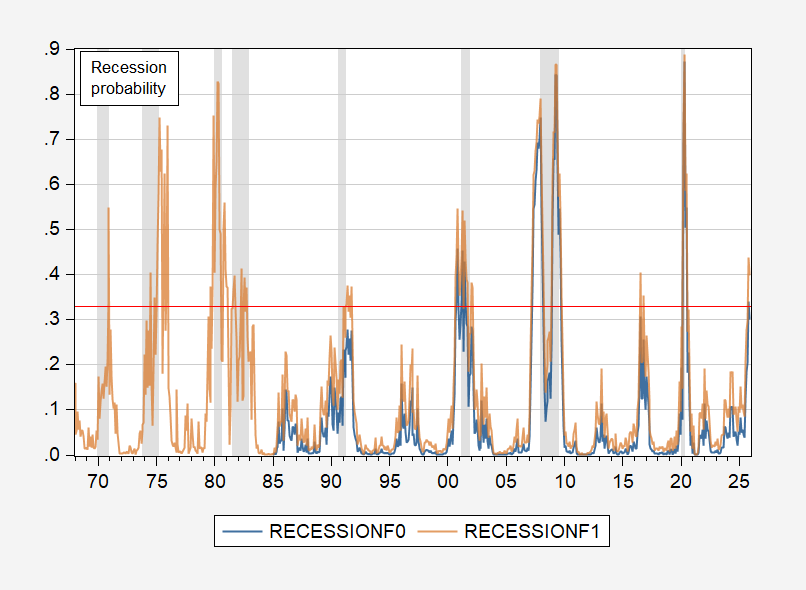
Figure 2: Estimated probability of recession from probit regression on 1968-2025M11 (tan), on 1986-2025M11 (blue). NBER defined peak-to-trough recession data shaded gray. Red dashed line at 33% threshold. Source: NBER, and author’s calculations.
Using a 33% threshold, a full sample probit has one false positive (2016), while a 1986-2025 probit regression has one false negative (1990-91). The October estimated probabiity using the restricted sample was 34%.
While this finding is intriguing, it’s important to recall that approaches like this rely upon historical correlations holding into the present. In other words, it’s important to consider what might be substantively different now. Case in point – a new 25% ad valorem tariff on heavy trucks (Section 232, USMCA value exempted), effective November 1st.
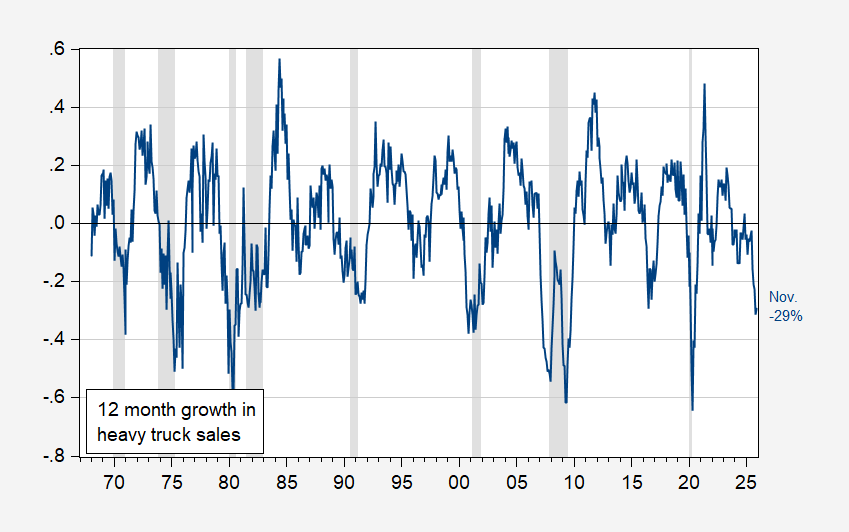
Figure 3: 12 month growth rate of heavy truck sales (blue). NBER defined peak-to-trough recession dates shaded gray. Source: Census via FRED, NBER and author’s calculations.
So, a cautionary note about reyling historical correlations in these unprecedented times.