My nowcast of BLS private nonfarm payroll employment was for a decreaes of 78K, but with a very wide prediction interval. This is an aggregate number; however, we can infer certain trends from the disaggregate (by firm size) numbers from ADP.
The financial accelerator approach (e.g., BBG, 1996)implies that smaller firms (with less collateral) will evidence a slowdown sooner than larger firms. Using the 500 employee cutoff, can we see the differential trends in the data?

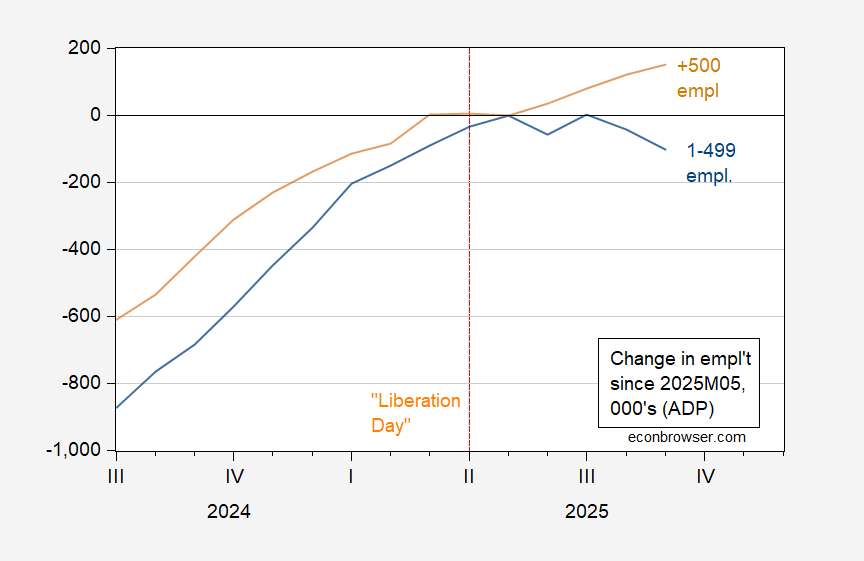
Figure 1: Change in employment from May 2025 in firms with less than 500 employees (blue), in firms with 500 and more employees (tan), both in 000’s, s.a. Source: ADP via FRED, and author’s calculations.

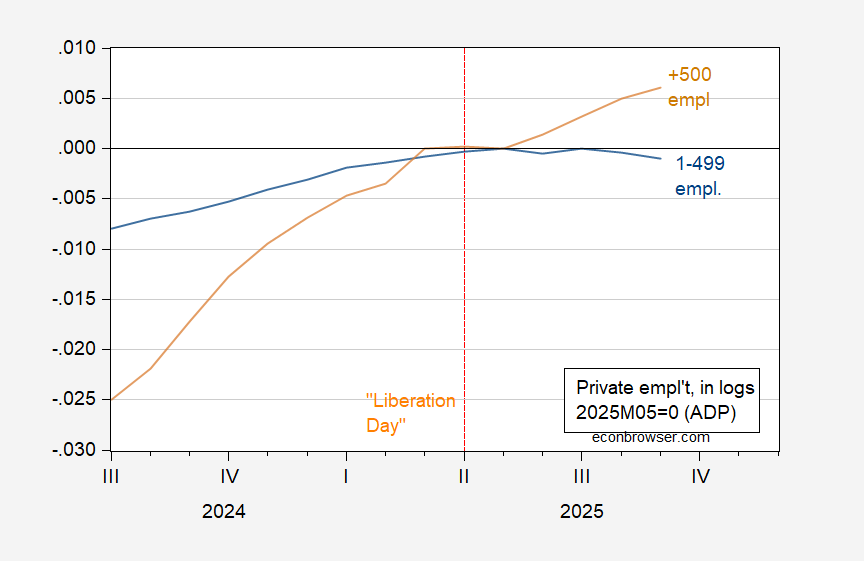
Figure 2: Employment in firms with less than 500 employees (blue), in firms with 500 and more employees (tan), in logs 2025M05=0. Source: ADP via FRED, and author’s calculations.
Private employment in firms with 1-499 employees constitutes about 80% of employment.
Seen either way, employment growth has essentially disappeared for “small” firms.
Addendum:
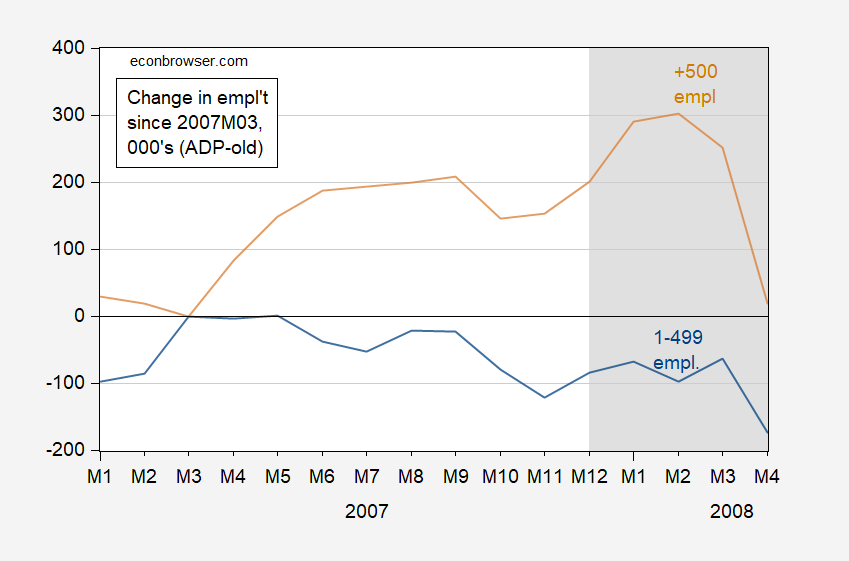
Note that in the runup to the 2007-09 recession, small firm employment declines led large firm by nearly a year.

Figure 3: Change in employment from May 2025 in firms with less than 500 employees (blue), in firms with 500 and more employees (tan), both in 000’s, s.a. NBER defined peak-to-trough recession dates shaded gray. Source: ADP (discontinued series) via FRED, and author’s calculations.

