
Inflation began rising in 2021 due to pandemic-related supply chain disruptions and reopening dynamics. The Russia-Ukraine war that started in February 2022 intensified these pressures through a commodity super cycle (a broad and sustained surge in energy and raw material prices) that sent inflationary shockwaves to nearly all major economies, including the U.S., where CPI inflation peaked at 9.1% in June 2022 (see Figure 1). But this event is noteworthy not because of how inflation rose, but rather the manner in which it tapered off, starting in 2023.
Figure 1. Core and Headline Inflation
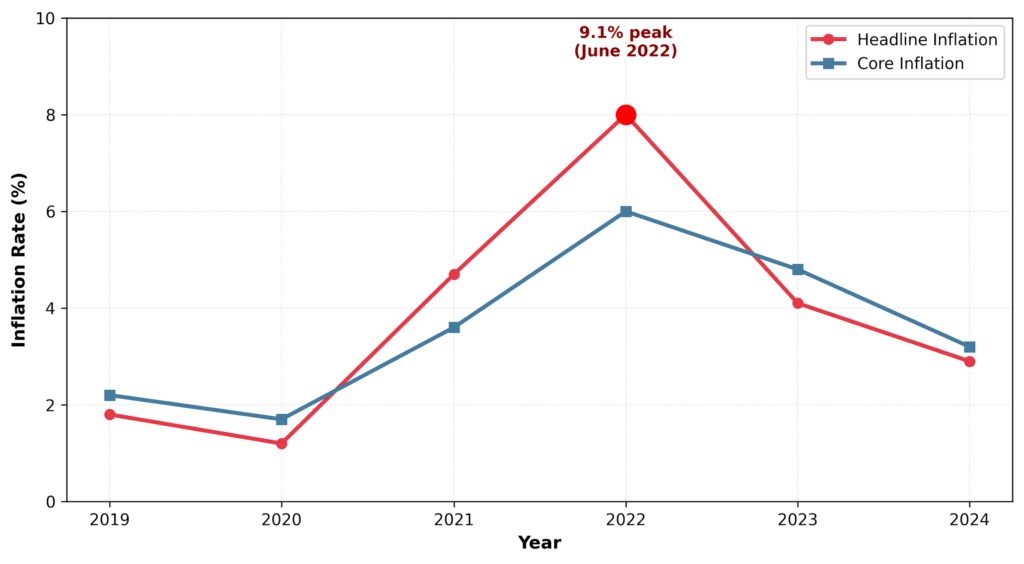
Headline inflation spiked in 2022 and then fell quickly, while core inflation declined more slowly.
Source: FRED and author’s own calculations
When inflation was rising rapidly in 2022, it was predicted that a sustained period of high unemployment would be required to bring inflation back to the Federal Reserve’s 2% target. Such predictions are closely aligned with the findings of the classic Phillips curve, which hypothesizes a trade-off between inflation and unemployment. These predictions were strongly rooted in the sacrifice ratio—the rise in unemployment typically required to reduce inflation by one percentage point.
Historical experience suggested that the sacrifice ratio would be substantial, but inflation declined significantly without a notable rise in unemployment. It remained low, fluctuating between 3.6% and 3.9% through 2021 and 2022. The sacrifice ratio turned out to be close to zero.
The big question that these events raise is whether the economists overestimated the persistence of supply-side shocks and the sensitivity of inflation to unemployment. Empirical evidence suggests that the Phillips curve was flatter, which would indicate a low sensitivity of inflation to changes in unemployment, and that inflation expectations were strongly anchored around the 2% target (Blanchard and Bernanke, 2023).
The situation developing in 2025–26 is considerably different and perhaps more challenging than the one we faced in 2022–23. Tariffs imposed in 2025–2026 provide evidence that might expand our understanding of how:
- 1. Supply-driven inflation operates, and
- 2. Policy can be used to combat inflation without an accompanying sacrifice.
In 2025–26, average U.S. tariff rates increased from 2.4% to nearly 18%. This increase resulted in $195 billion in customs duties in fiscal year 2025 (Yale Budget Lab, 2025). Surveys show American firms expect tariffs to account for 40% of their total unit cost growth in 2025–2026 (Bostic2025). Simultaneously, more than 55% of businesses now cite geopolitical factors as a top supply chain concern in 2025, up from just 35% in 2023 (Risk Management Magazine, 2025).
The decline in inflation without a rise in unemployment underscores the importance of incorporating supply-side dynamics and expectations anchoring into macroeconomic policy.
Supply chain disruptions and energy price shocks were less persistent than anticipated during the 2022–23 inflationary episode. Energy prices dropped significantly, from over $120/barrel in June 2022 to $70–$90/barrel in late 2023 (see Figure 2). Global supply chain pressures also normalized by mid-2023 (Morales, 2025). Economists missed the mark when it came to the duration of this shock, having widely expected that supply and energy pressures would remain elevated well into 2024, rather than normalizing by mid‑2023.
Figure 2. Brent Crude Price
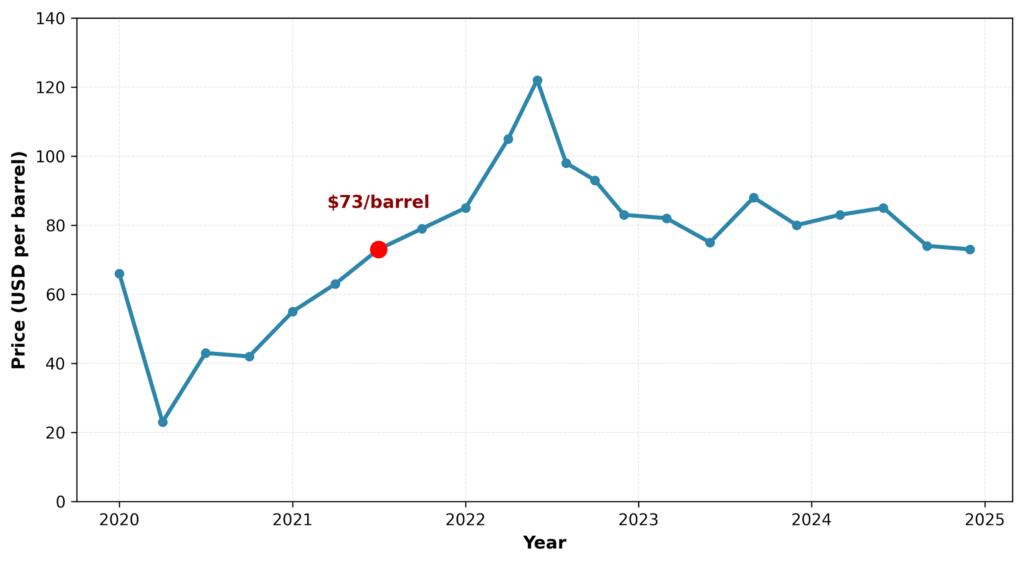
Brent crude prices fell sharply from mid-2022 peaks to much lower levels by late 2023.
Source: FRED
The 1970s experience suggested a longer supply-side shock and an unemployment cost associated with disinflation (Dolan, 2023). The supply-side environment in the 2020s differs in important ways. In addition, a tariff-induced supply shock operates differently than pandemic-era disruptions.
Analysis from Cavallo, Llamas, and Vasquez (2025) shows that imported goods prices rose approximately 4%–6.2% between March and September 2025, while domestic goods increased 2%–3.6%. Prices for domestically produced goods have also increased, suggesting tariffs create inflationary pressure beyond imported items.
The labor market showed resilience when returning workers kept wage growth at moderate to low levels despite low unemployment. Wage growth decelerated from 5.9% in March 2022 to 4.3% in October 2023, indicating easing labor market pressures and a lower rate of inflation without an accompanying employment sacrifice (see Figure 3). Many observers initially thought that as people came back to work, companies would have to keep raising pay sharply to attract them, putting more upward pressure on prices. Instead, the increase in available workers made it easier for firms to hire without pushing wages up as much, so pay growth slowed even though unemployment stayed low.
Figure 3. Wage Growth and Unemployment Rates in the US

Wage growth slowed even as unemployment stayed low.
Source: FRED and author’s own calculations
High credibility of the Fed was important in anchoring inflation expectations around the Fed target of 2%. When expectations are “anchored,” people largely trust that inflation will stay close to 2%, so they don’t plan for big, ongoing price increases. The Fed’s credibility, coupled with an aggressive communication strategy, seems to have established an expectations regime that limited second-round effects from wage-price spirals (rising wages push up costs, which in turn drive further price increases). This reflects a fundamental policy shift from adaptive to anchored expectations tied to the central bank’s stated target.
An inflation-targeting central bank and the anchoring of inflation expectations were largely theoretical before the 2021–2022 inflation episode. The ideas came to life as unemployment remained near historic lows while inflation tapered off, as measured by the 5-year breakeven inflation rates that remained stable around 2%.
Despite tariff pressures, long-term inflation expectations have remained relatively stable. Atlanta Fed President Raphael Bostic stated in November 2025 that inflation poses the larger risk to the Fed’s dual mandate (its twin goals of price stability and maximum employment), while Fed Vice Chair Philip Jefferson noted that the “lack of progress” on the inflation target “appears to be due to tariff effects.” The challenge for policymakers is to distinguish between one-time price level effects from tariffs and sustained inflationary pressures that require monetary tightening (raising interest rates to cool demand).
The 2021–2023 inflation episode shows that supply-driven disinflation can have a near-zero sacrifice ratio when shocks are transitory and expectations stay anchored. But 2026 presents a different challenge. Inflation remains above the Fed’s 2% target and the labor market is now weakening. With unemployment already rising, the Fed cannot use the 2021–2023 playbook of waiting for supply pressures to resolve while maintaining tight policy. Any further monetary tightening to combat tariff-induced inflation risks more job losses, slower hiring, and weaker income growth for workers.
One of the critical lessons for policymakers is to stop looking away from supply-side dynamics—things like broken supply chains or sudden spikes in raw material costs that push prices up from the production end. They must account for the transitory nature of supply shocks in future inflation forecasts. This lesson applies directly to current tariff-driven inflation. While the Federal Reserve can maintain expectations anchoring through clear communication, it cannot offset the direct price level effects of tariffs without imposing economic costs. The policy challenge is compounded because tariffs are discretionary policy choices, not exogenous shocks.
The 2021–2023 experience and the current 2025–2026 environment highlight the importance of coordination between monetary and trade policy. Recent analysis by Yahoo Finance (2025)based on J.P. Morgan Global Research, estimated that announced tariff measures could boost Personal Consumption Expenditures prices by 1.0–1.5 percentage points in 2025. Central bank credibility must be preserved carefully, as it can be eroded if policy-induced shocks repeatedly push inflation above target.
The challenge in 2025–26 is responding to a different type of supply shock, one that is driven by trade policy distortions rather than supply-chain disruptions, with minimal economic disruption.
The key lesson for policymakers is that when inflation expectations are anchored and supply shocks are distinct from demand pressures, the costs of disinflation can be substantially lower than traditional models suggest. Achieving disinflation with such low costs requires policy coordination and sustained central bank credibility in an unusually uncertain environment.